
Transit KPI Dashboard & Fleet Monitoring Platform
Bus RT Insights transforms operational transit data into actionable intelligence with automated processing, customizable calculations, and dashboards your entire organization can access — without installing software or additional on-board hardware.
Easy to share across your organization
Works on any device
No download or installation
Automated Analytics
Bus RT Insights processes GTFS, GTFS-Realtime, CAD/AVL, and ridership data automatically — keeping metrics current without manual data wrangling.
- Automated data processing
- Automated report mailings
- Data extraction for custom reports
- Uses existing on-board infrastructure
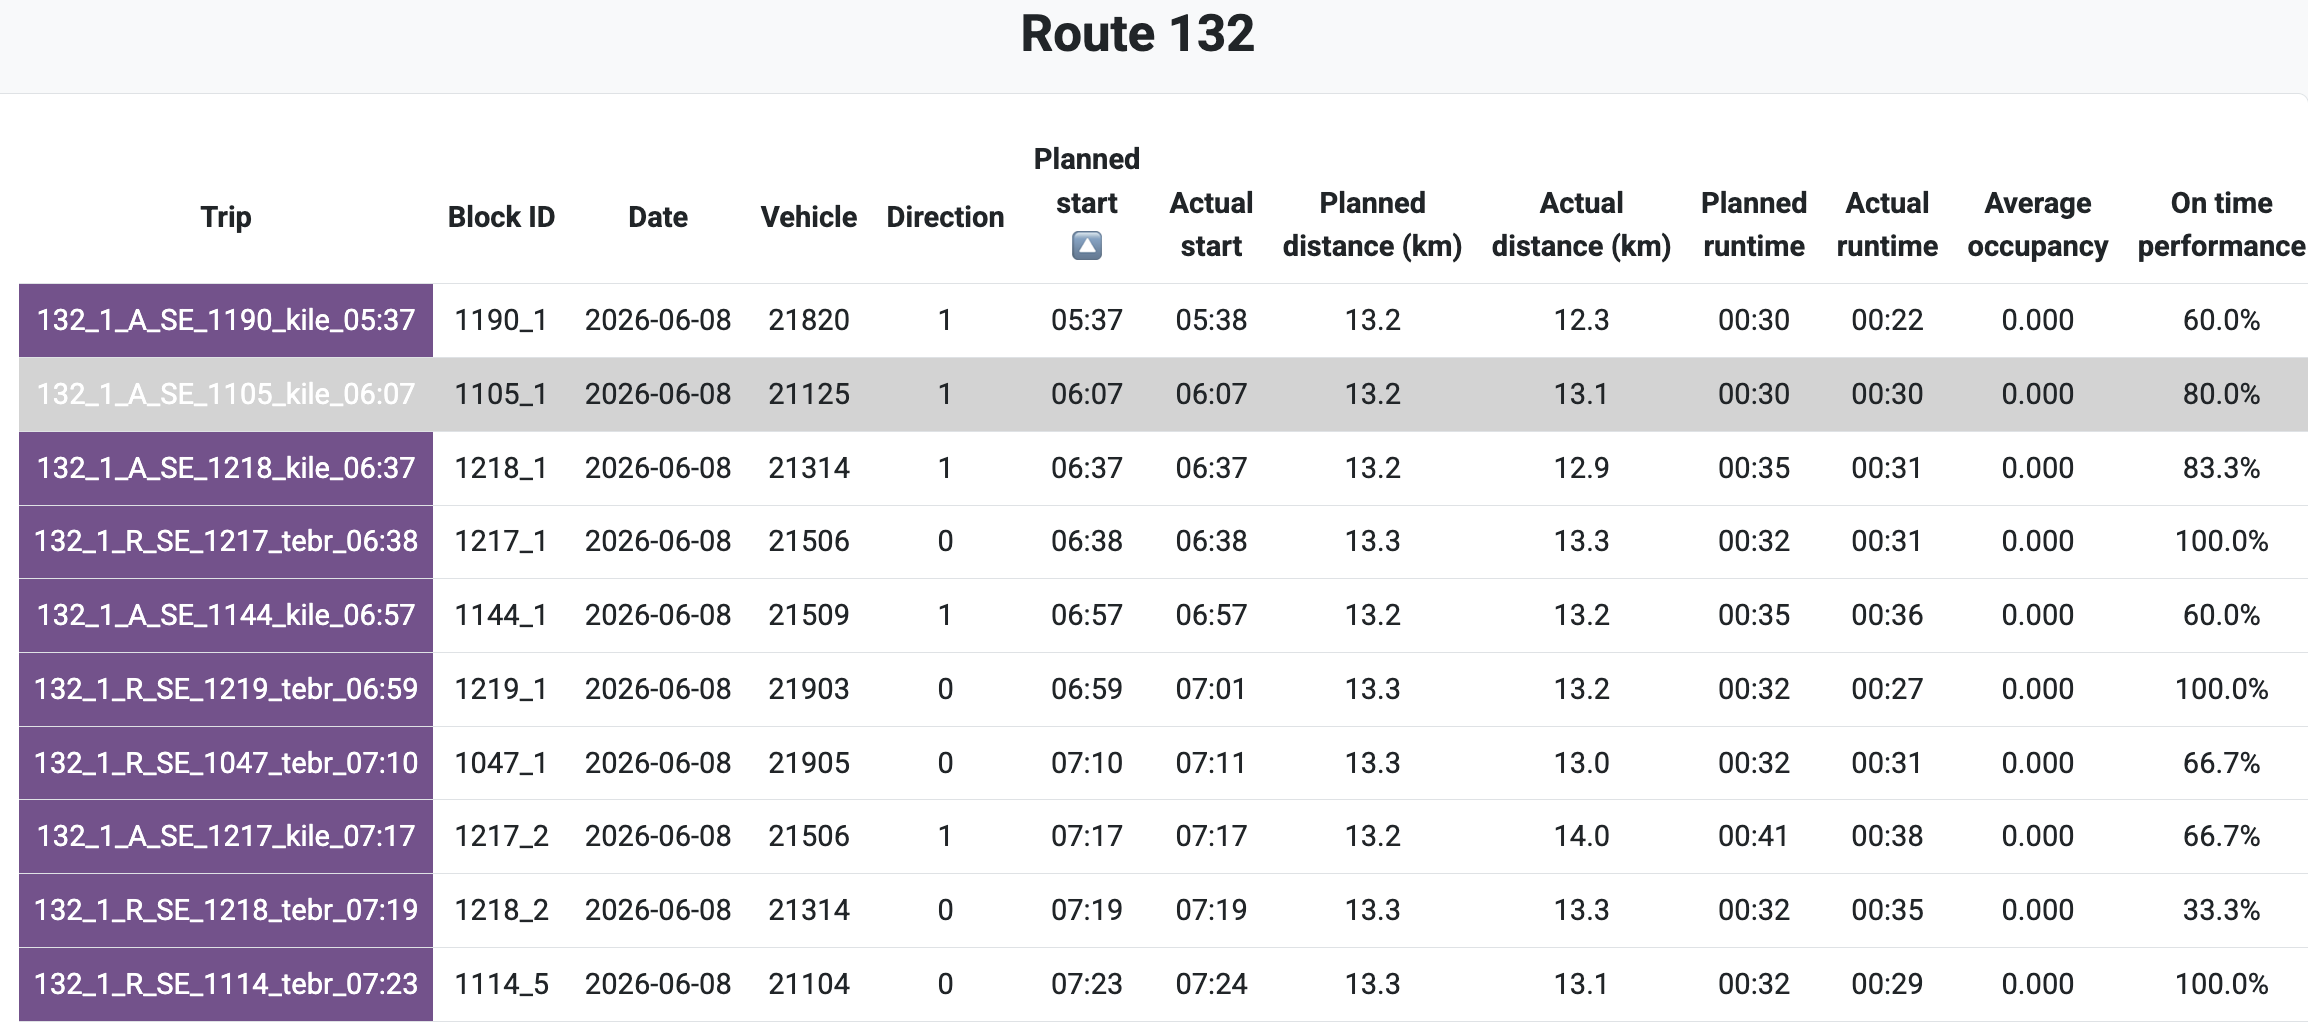
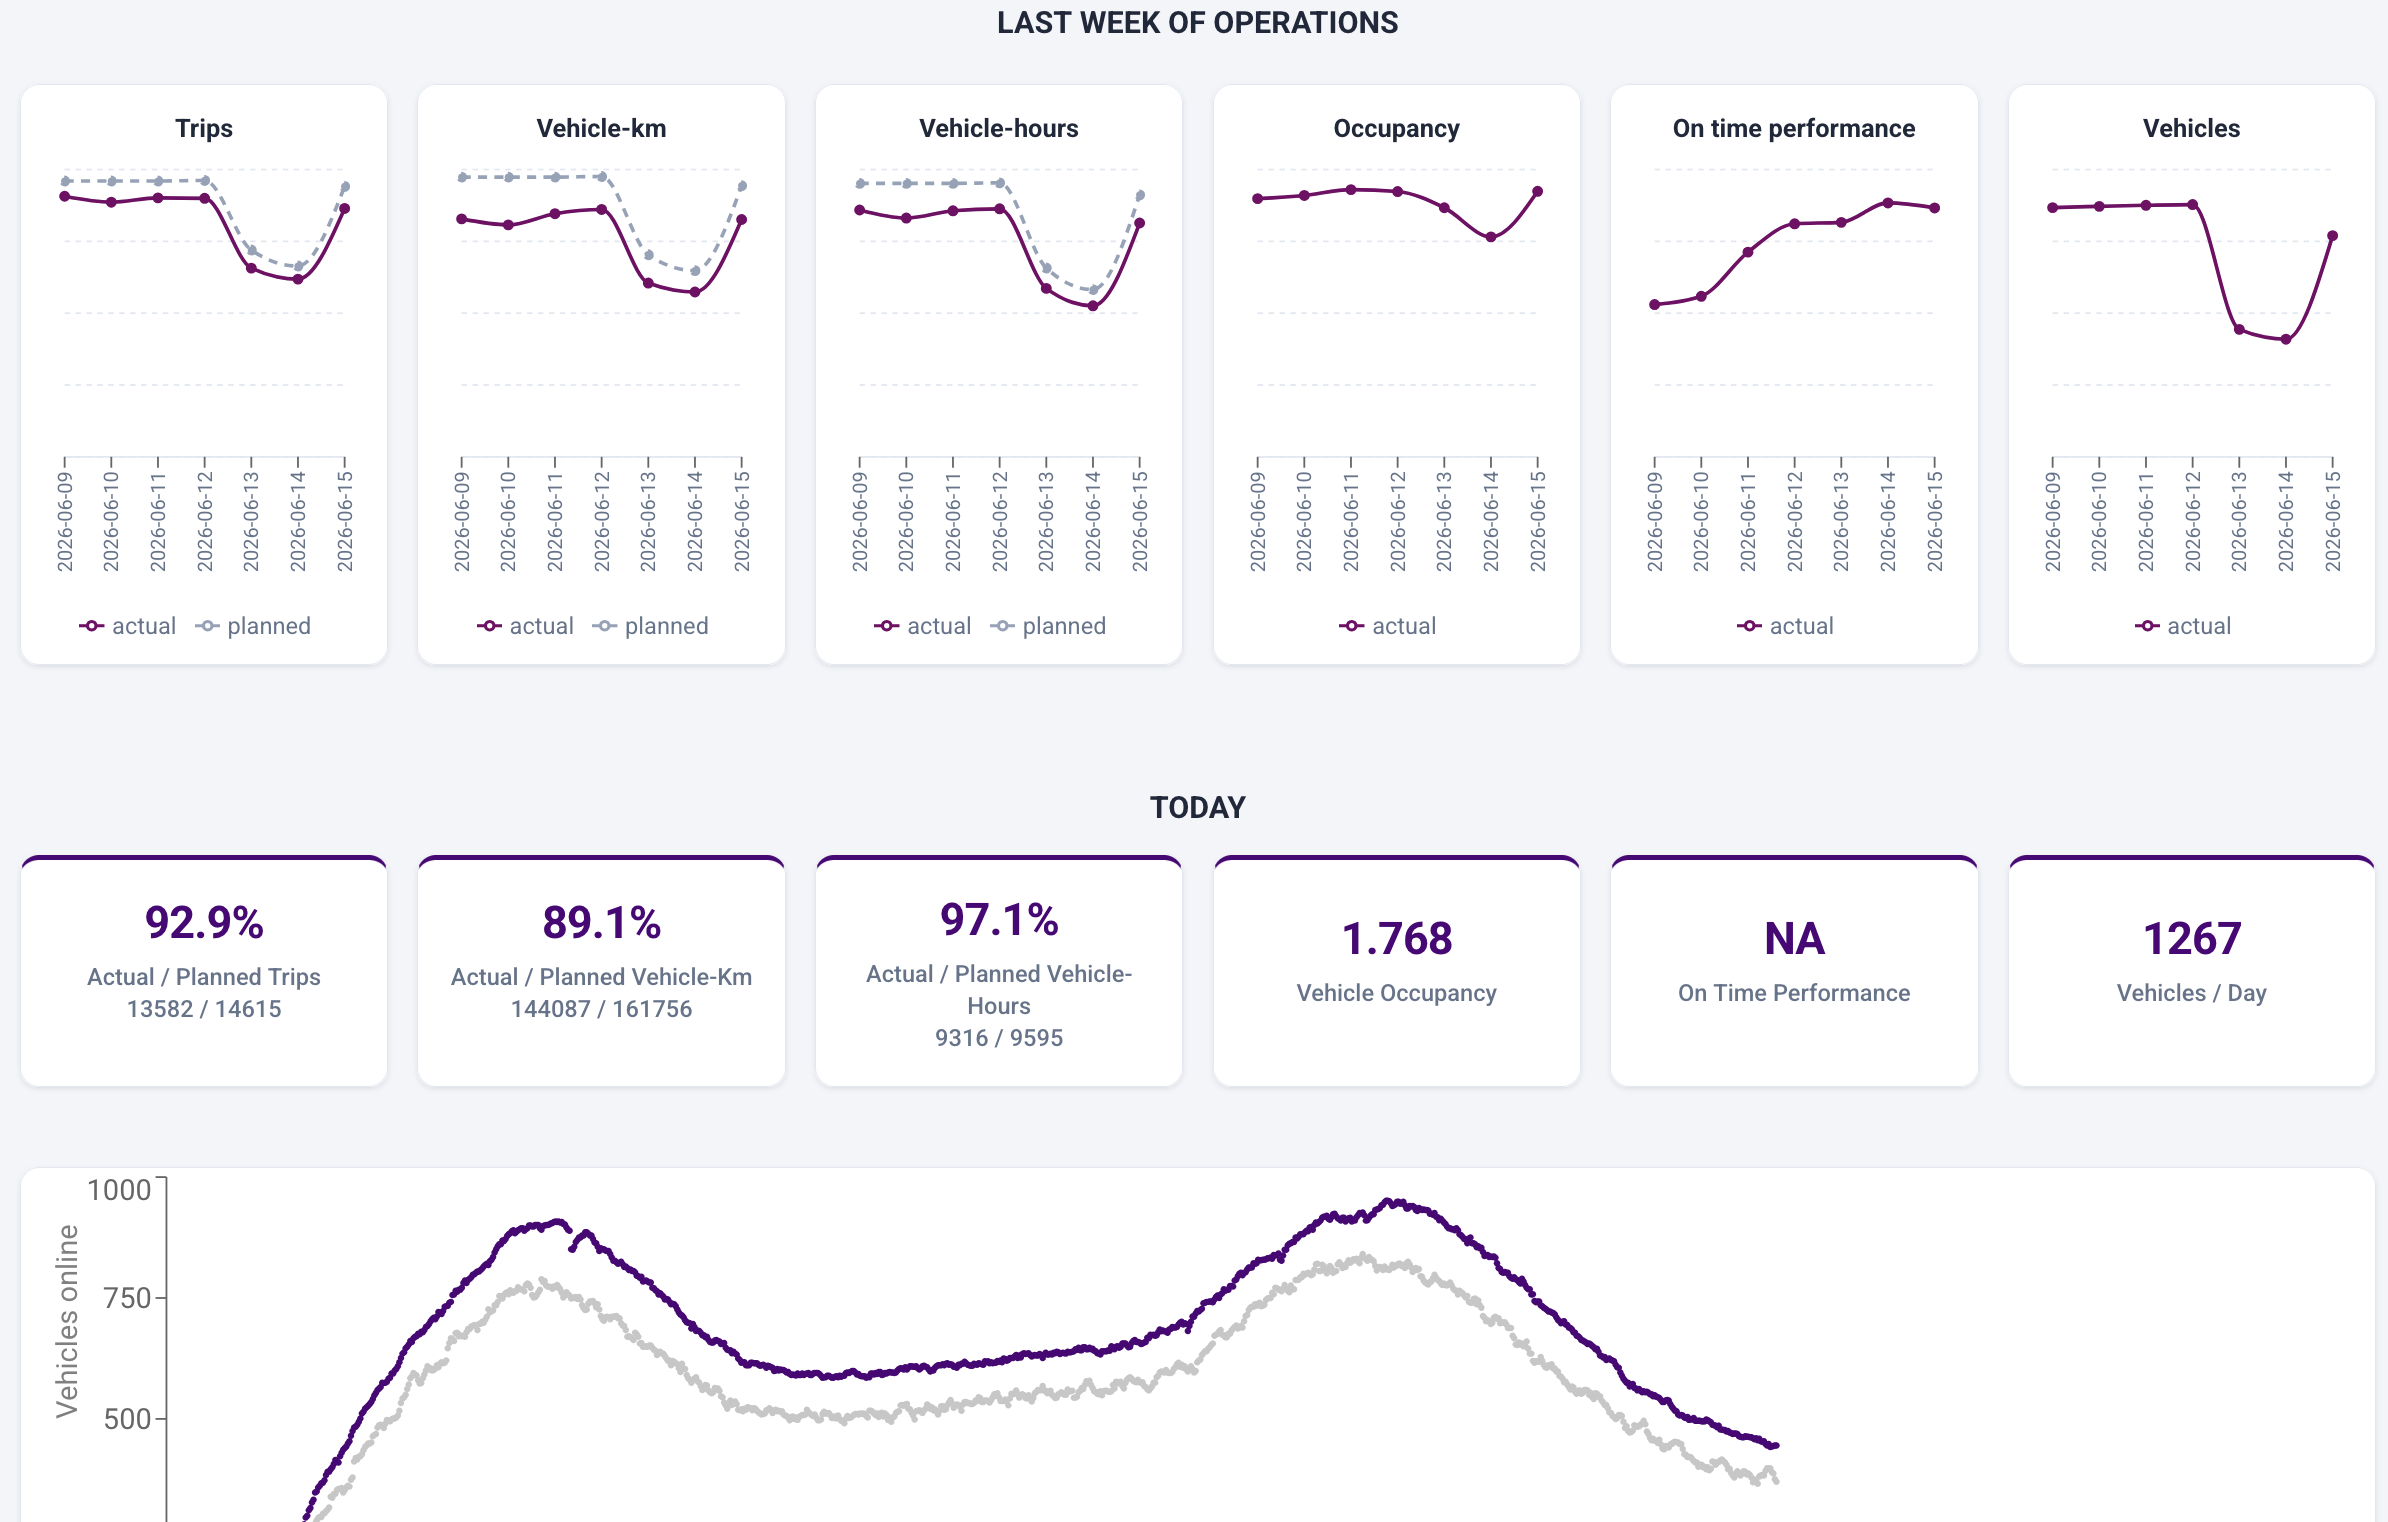
Key Metrics
Track the metrics transit agencies rely on daily, with planned vs. actual comparisons built in.
- On-Time Performance
- Ridership
- Planned & Actual Trips
- Planned & Actual Vehicle-km
- Planned & Actual Vehicle-hours
- Service Curve
- Fleet Usage
Customizable Calculations
Adapt performance measurement to your agency's policies and operating environment.
- Configurable on-time performance windows
- Custom spatial boundaries
- Agency-specific calculation rules
- Service curve analysis
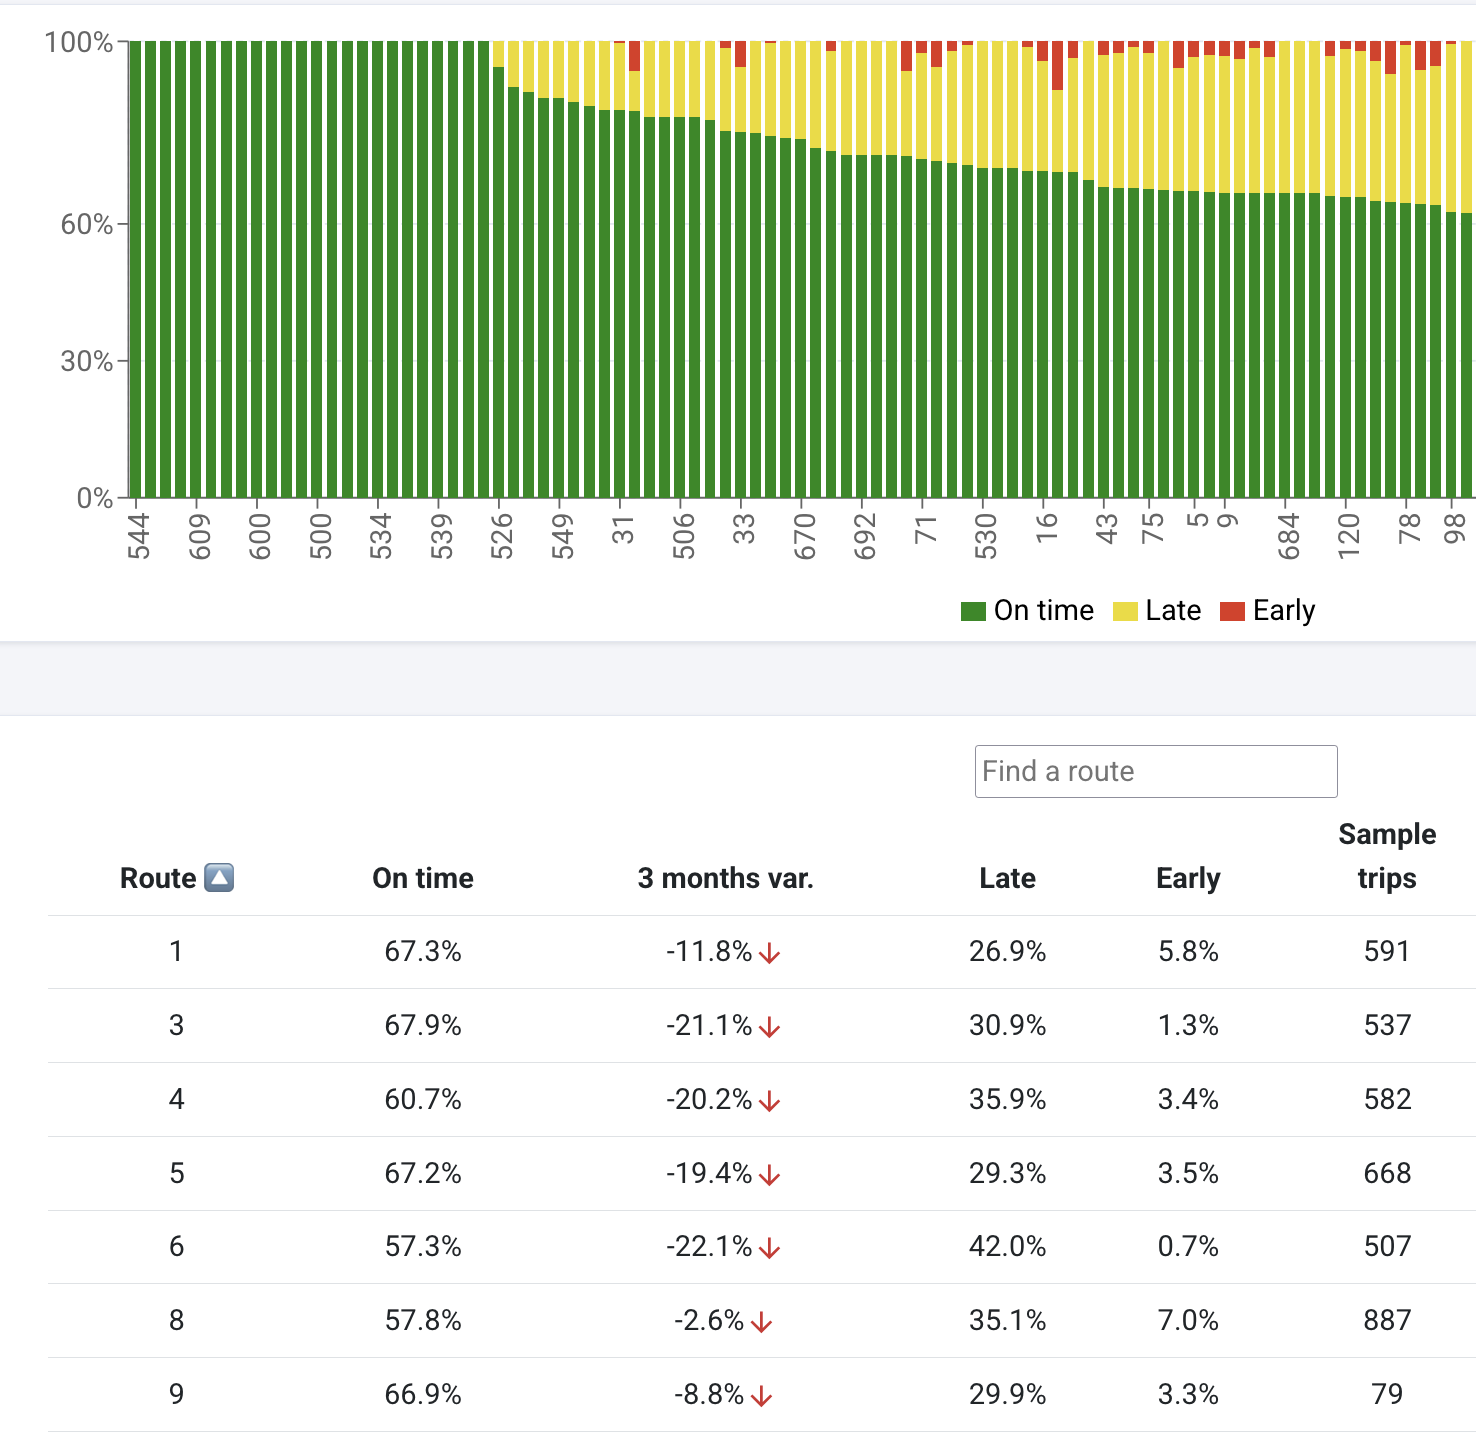
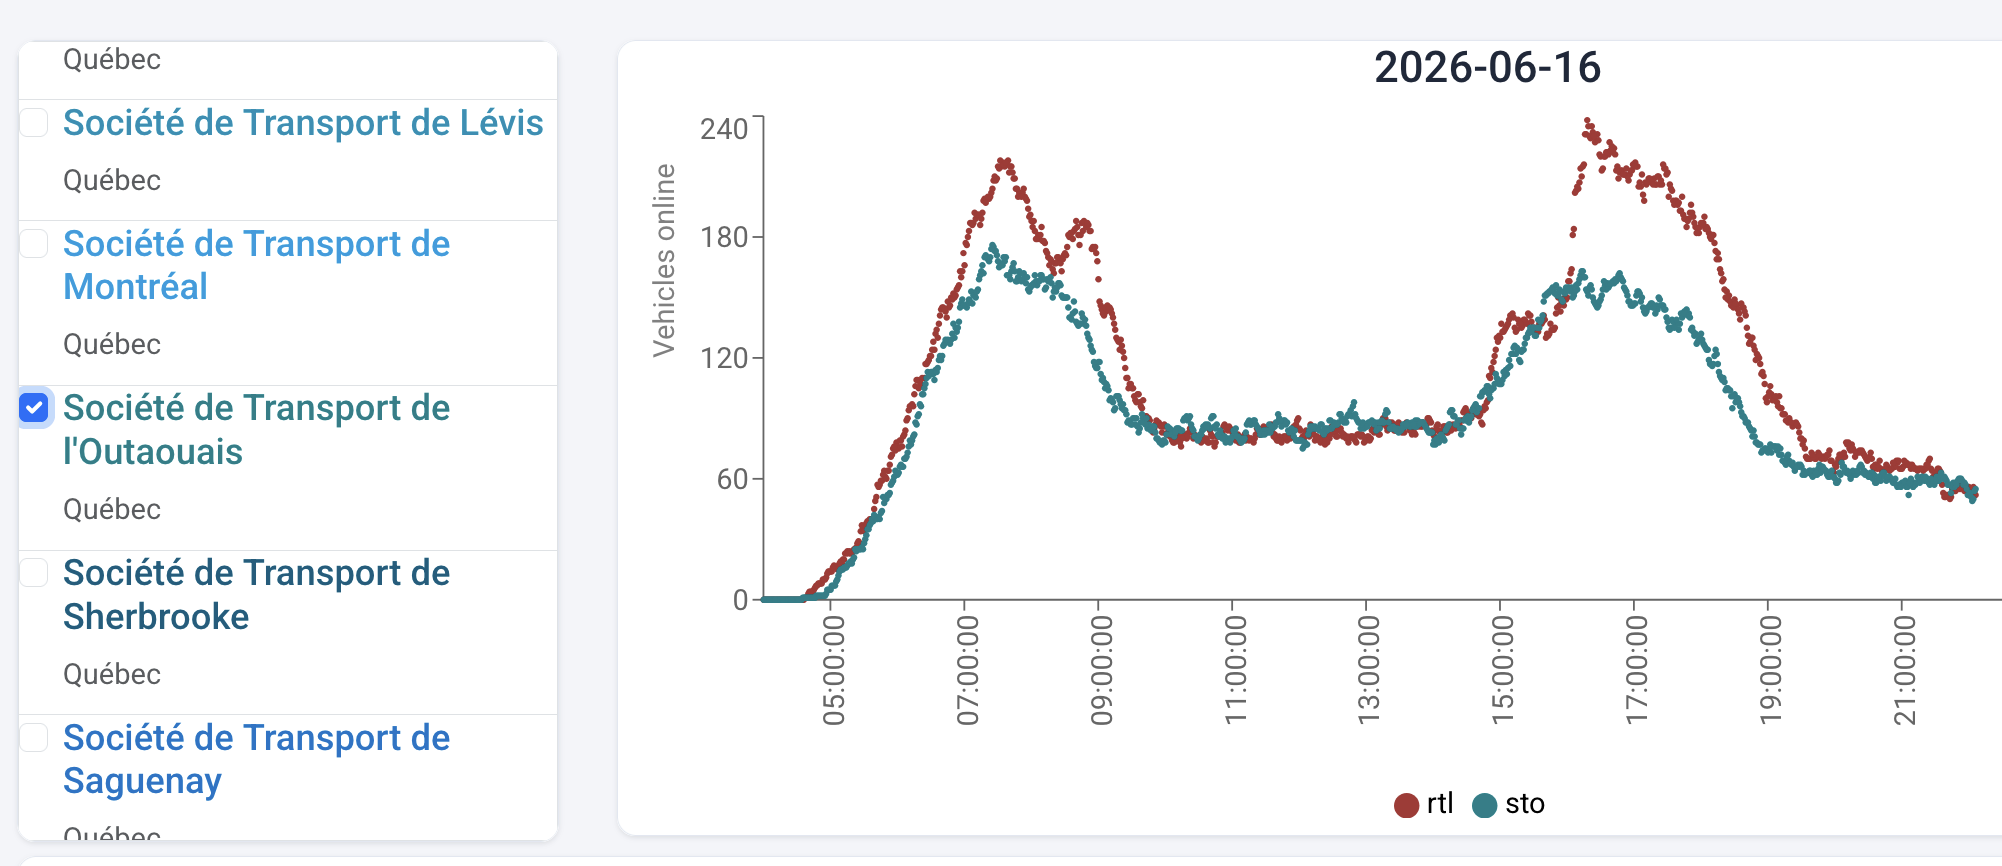
Benchmarking
Compare performance across routes, periods, or agencies using standardized metrics for peer and regional analysis.
- Benchmark different agencies
- Standardized metric definitions
- Planned vs. actual comparisons
- Cross-operator reporting
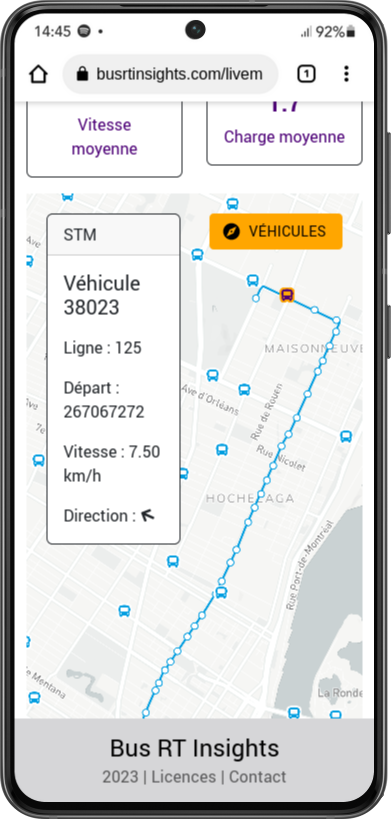
Works on Any Device
Access the platform wherever your team works — in the field, at the office, or on the go.
- Phone, tablet, and desktop compatibility
- No download or software installation
- Responsive design for all screen sizes
- Browser-based access from anywhere
Turn transit data into operational intelligence.
Schedule a personalized demonstration of Bus RT Insights.
Request Demo