
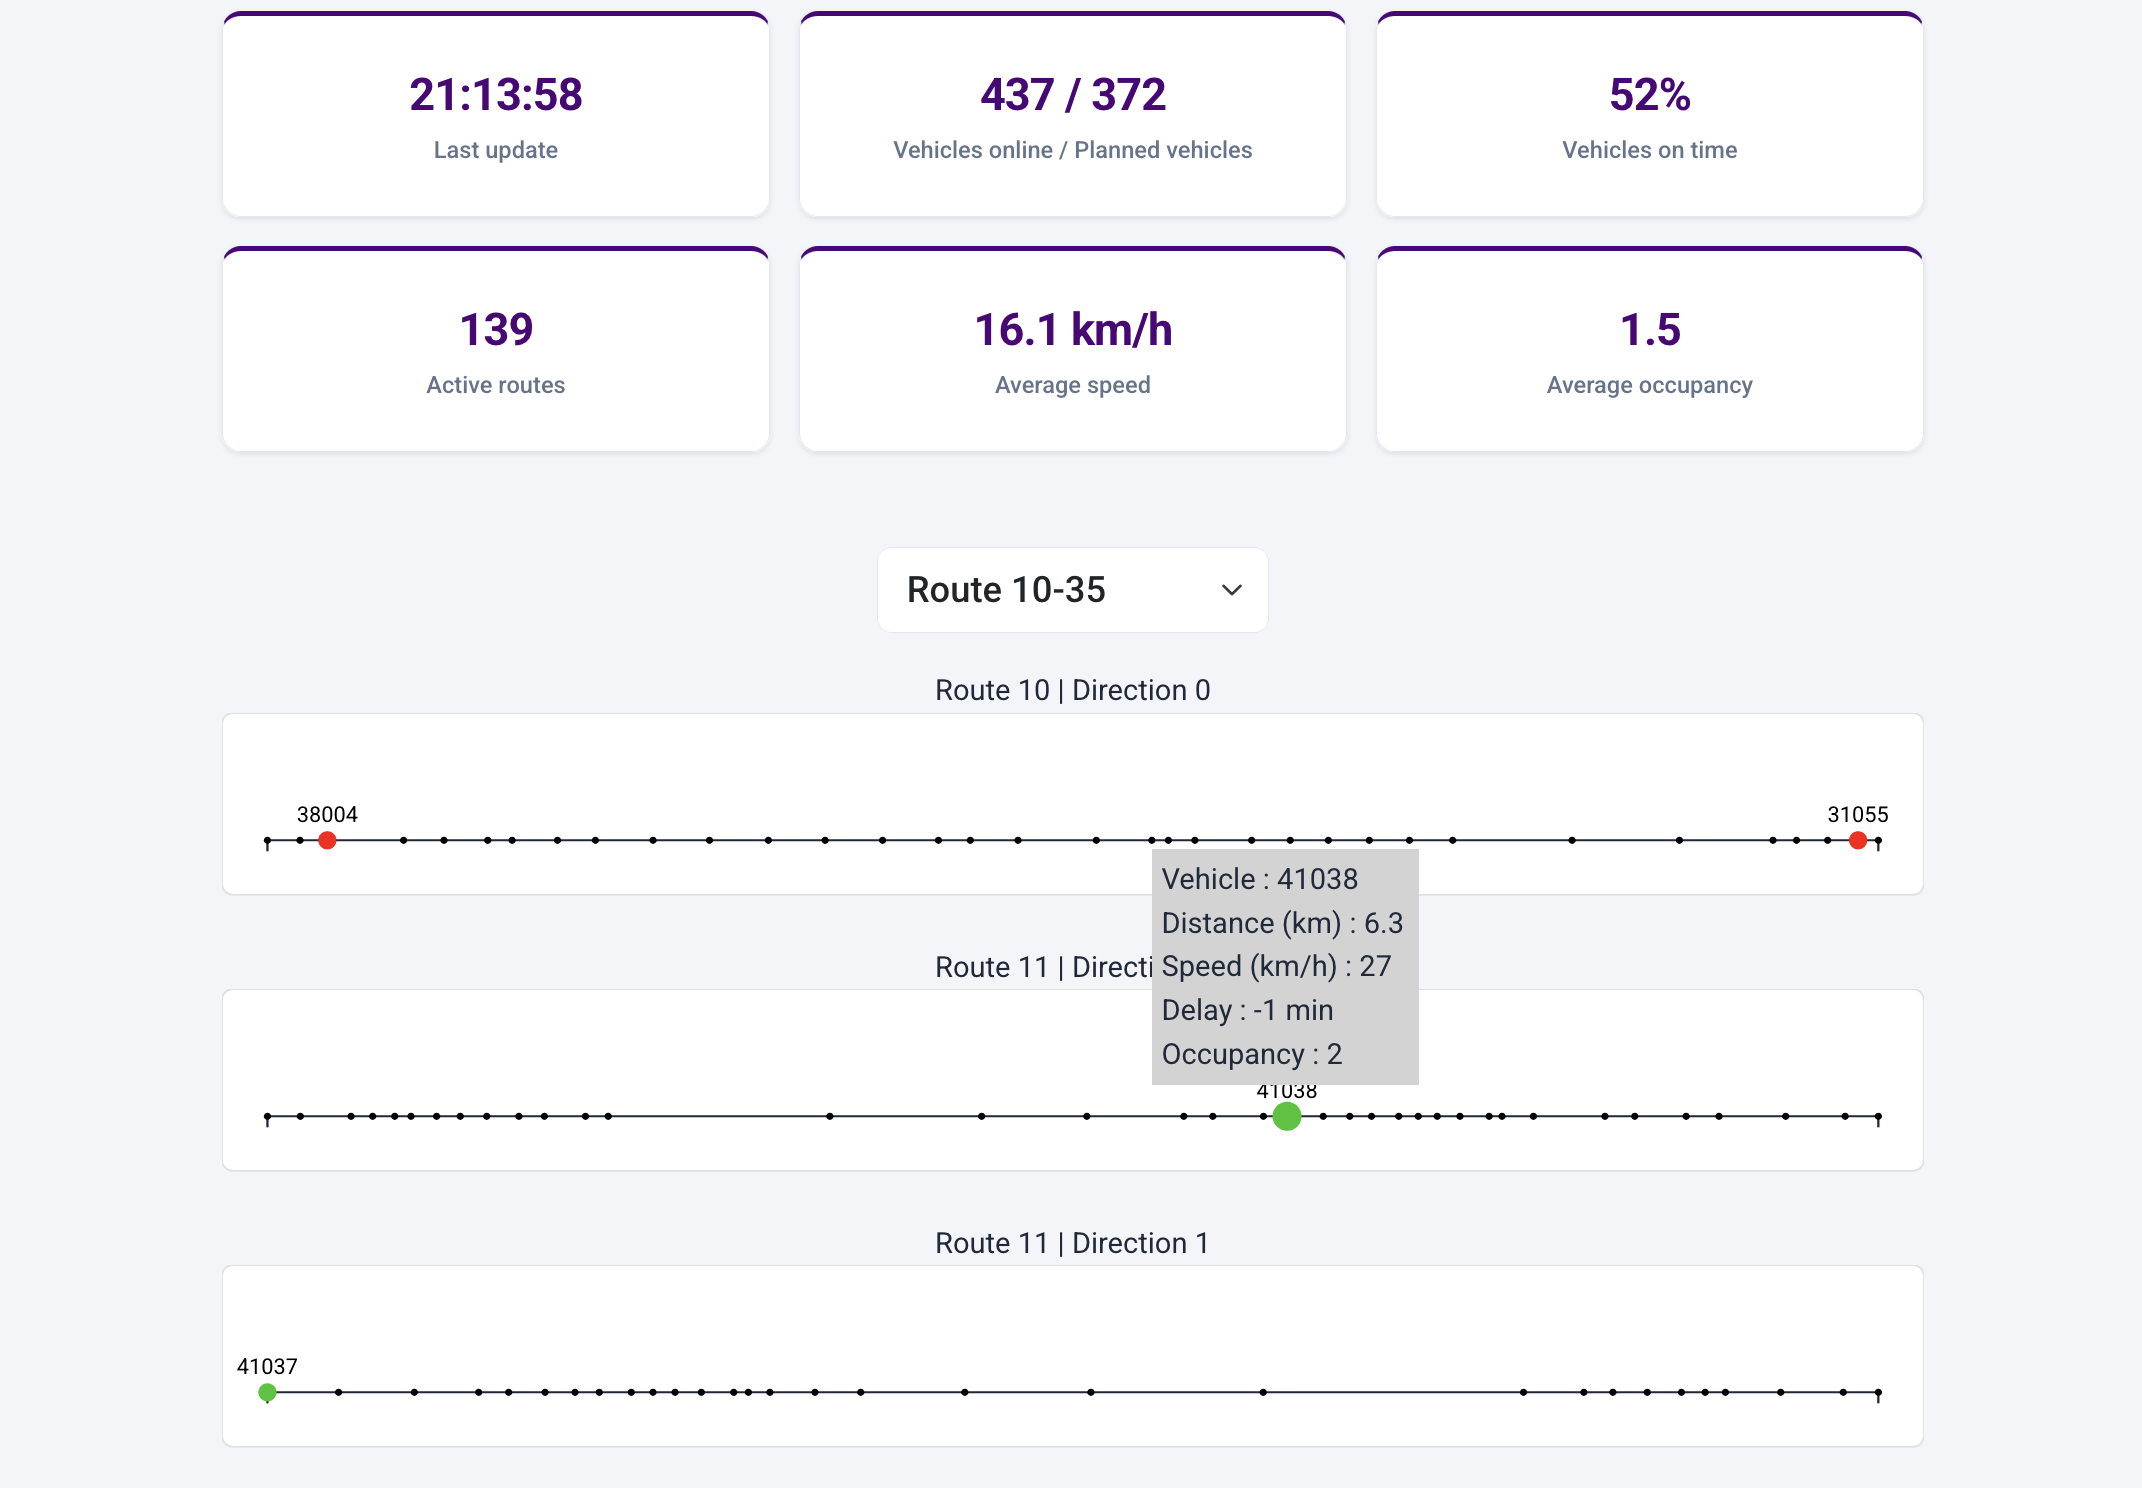
Live Operations
Monitor fleet usage, service curves, and trip progression using data from your existing on-board infrastructure.
Turn operational transit data into actionable intelligence with automated processing, customizable KPIs, and dashboards your whole organization can access — on phone, tablet, or desktop, with no software to install.
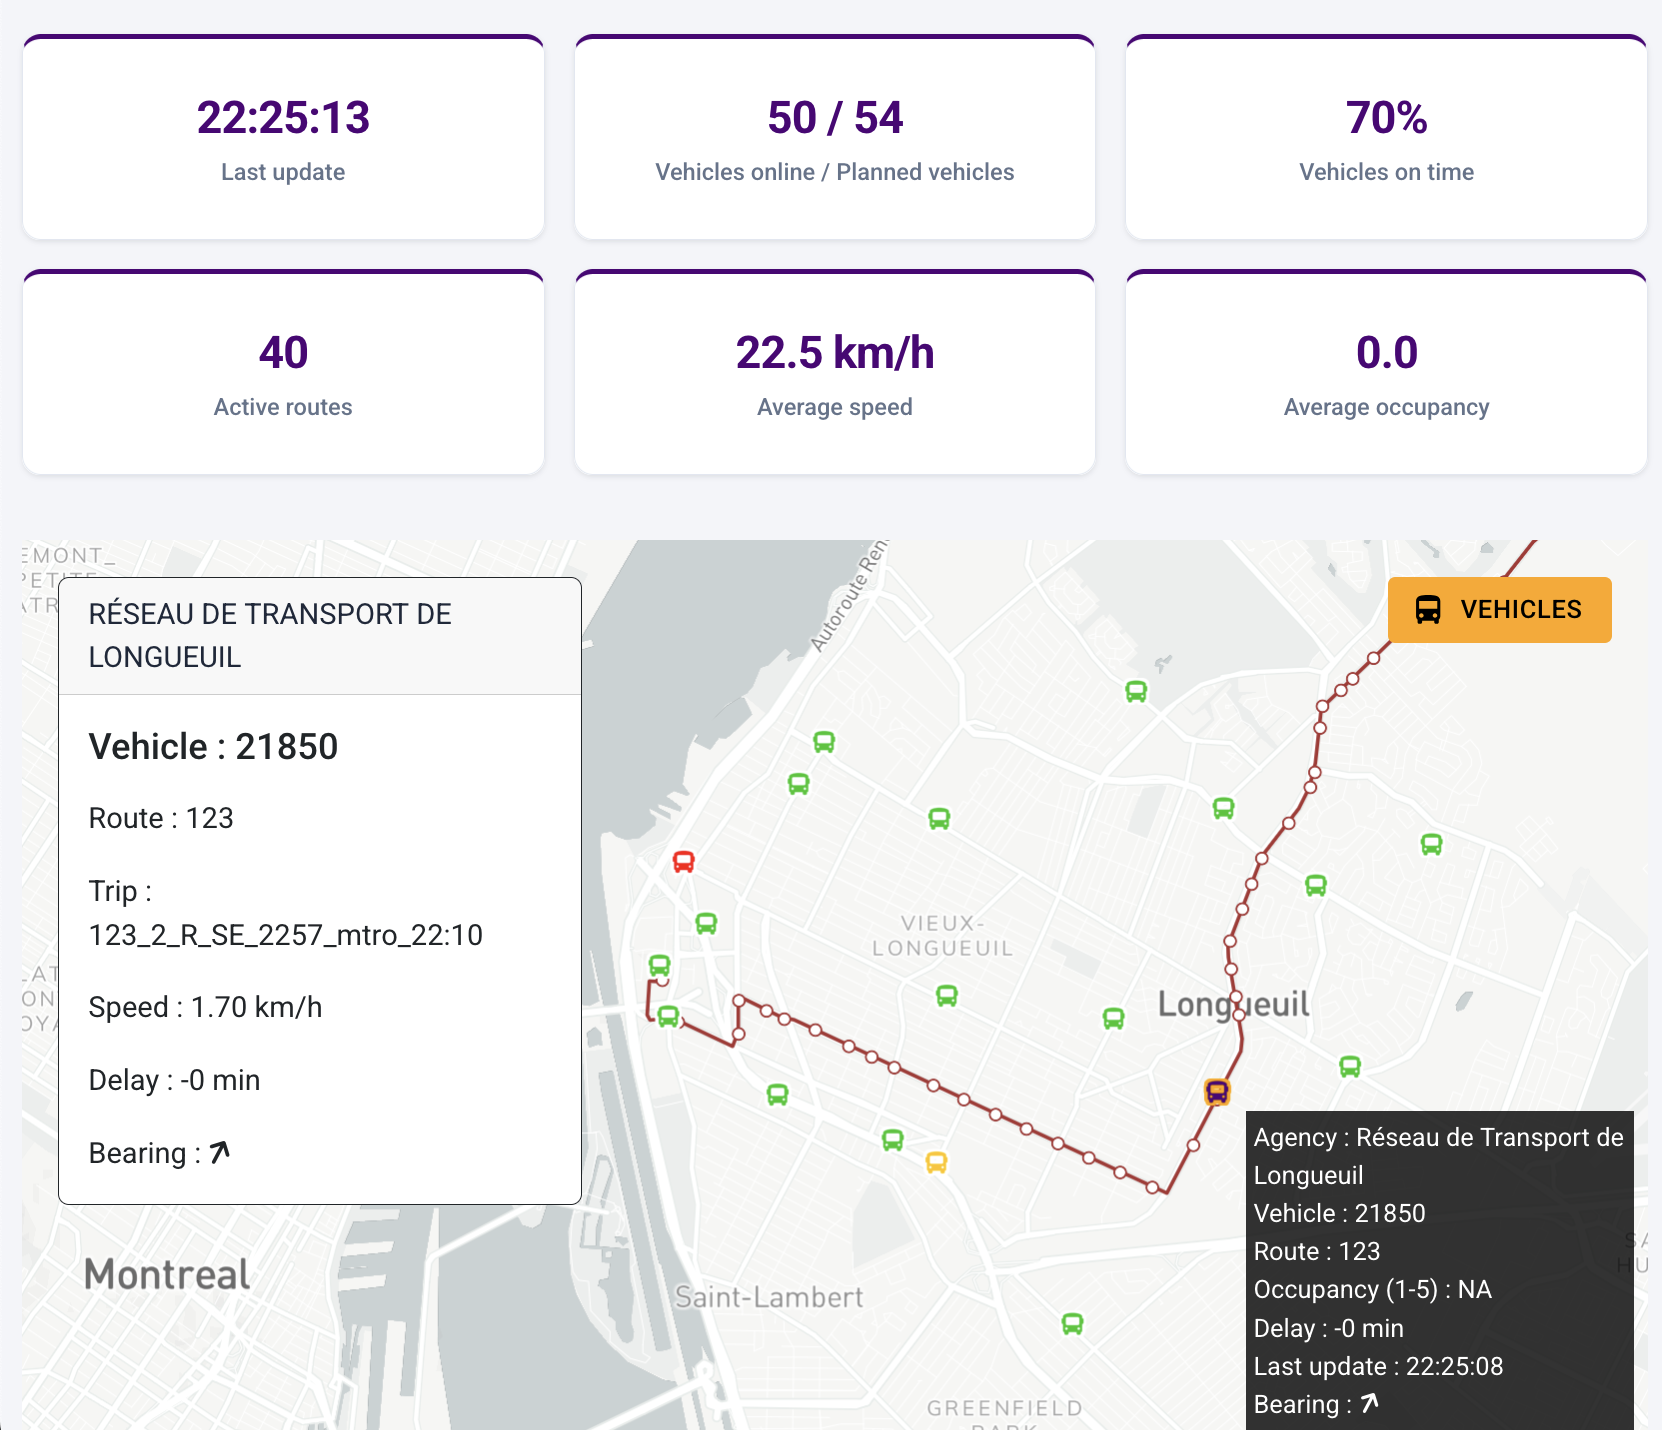
Automated analytics built on your existing data infrastructure — from live operations to executive reporting.
Monitor fleet usage, service curves, and trip progression using data from your existing on-board infrastructure.
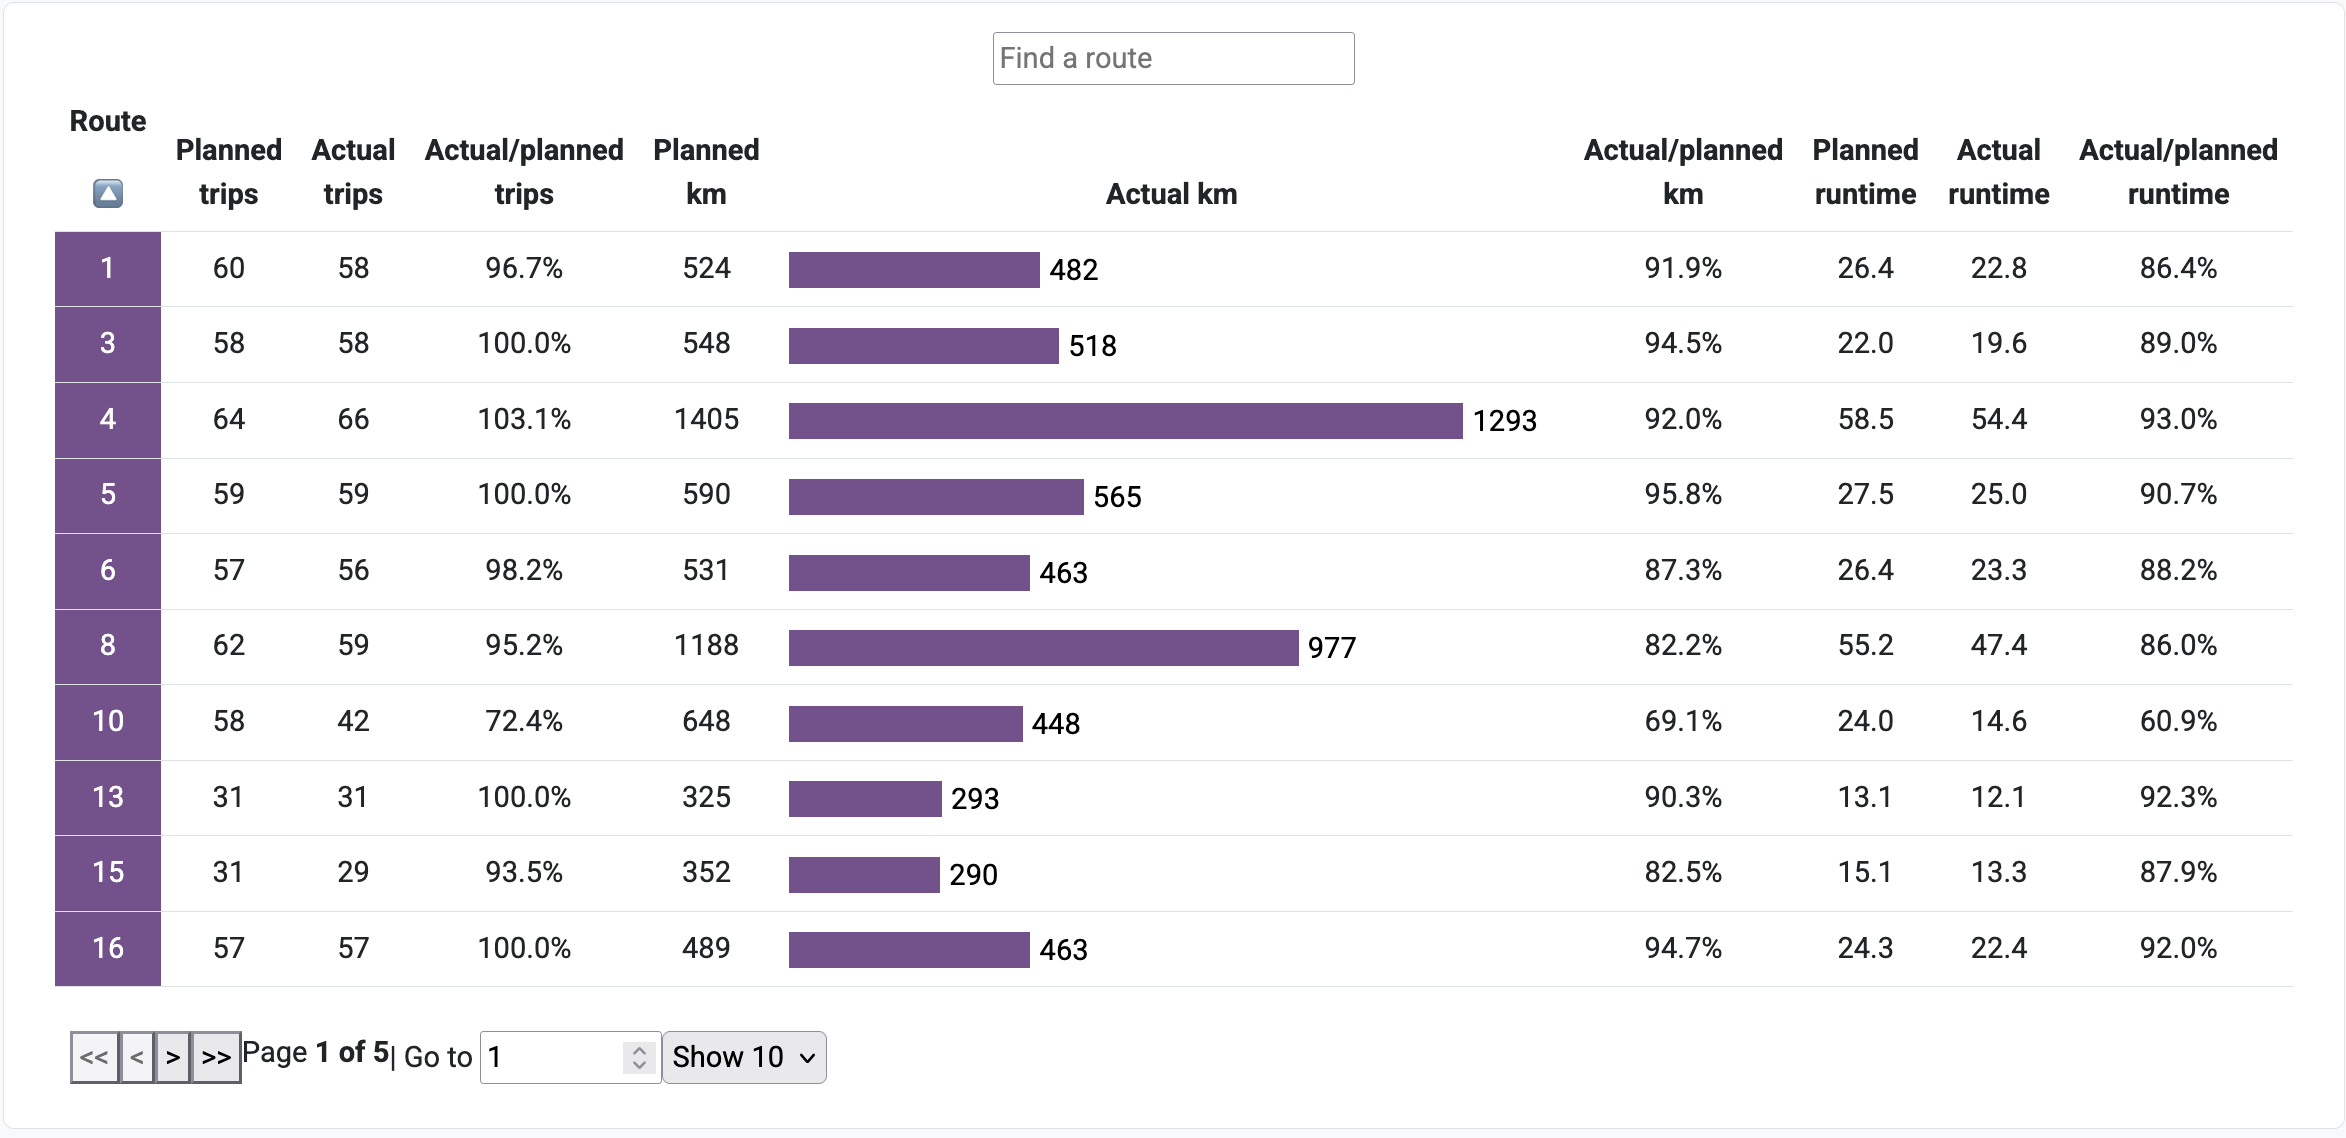
Track on-time performance, ridership, and planned vs. actual trips in real time with customizable calculation rules.
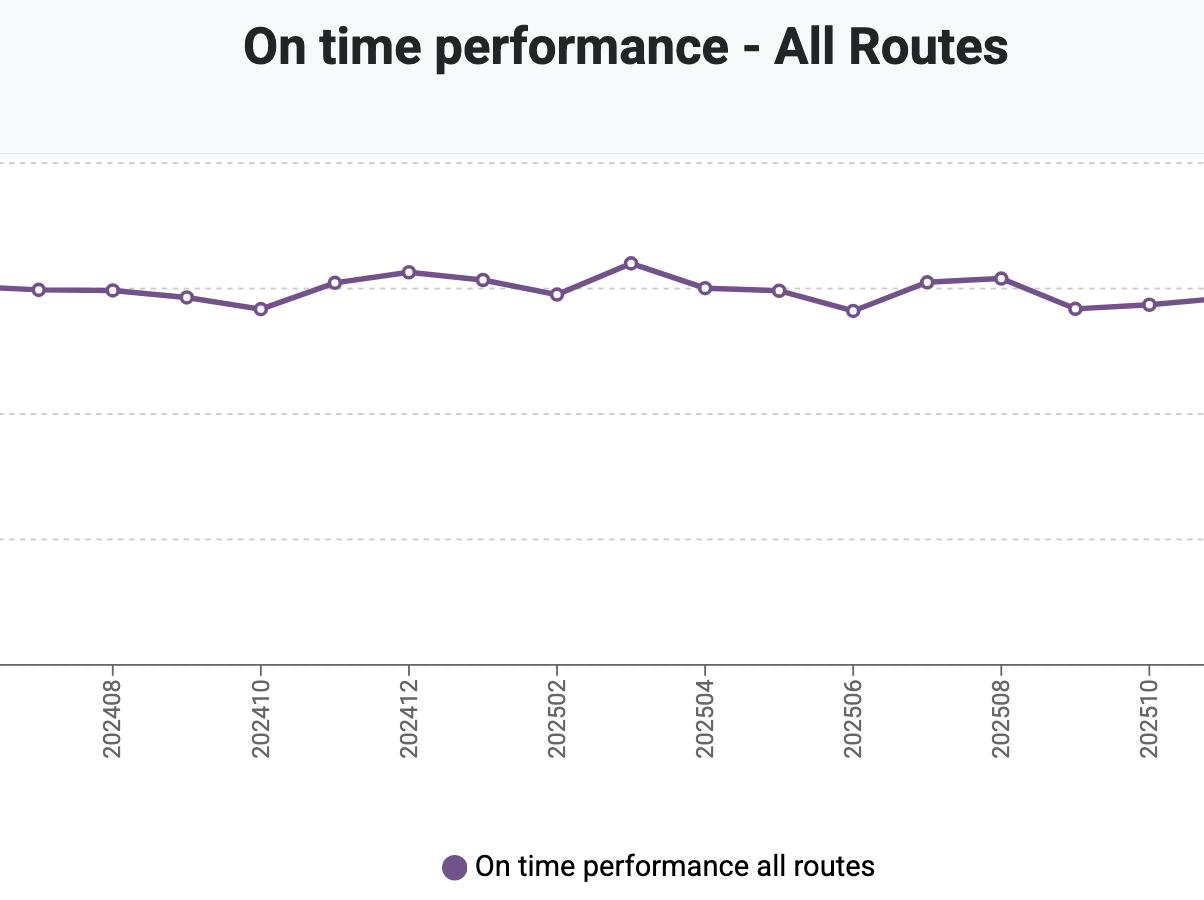
Compare routes, months, and years to identify patterns and support planning, scheduling, and executive decision-making.
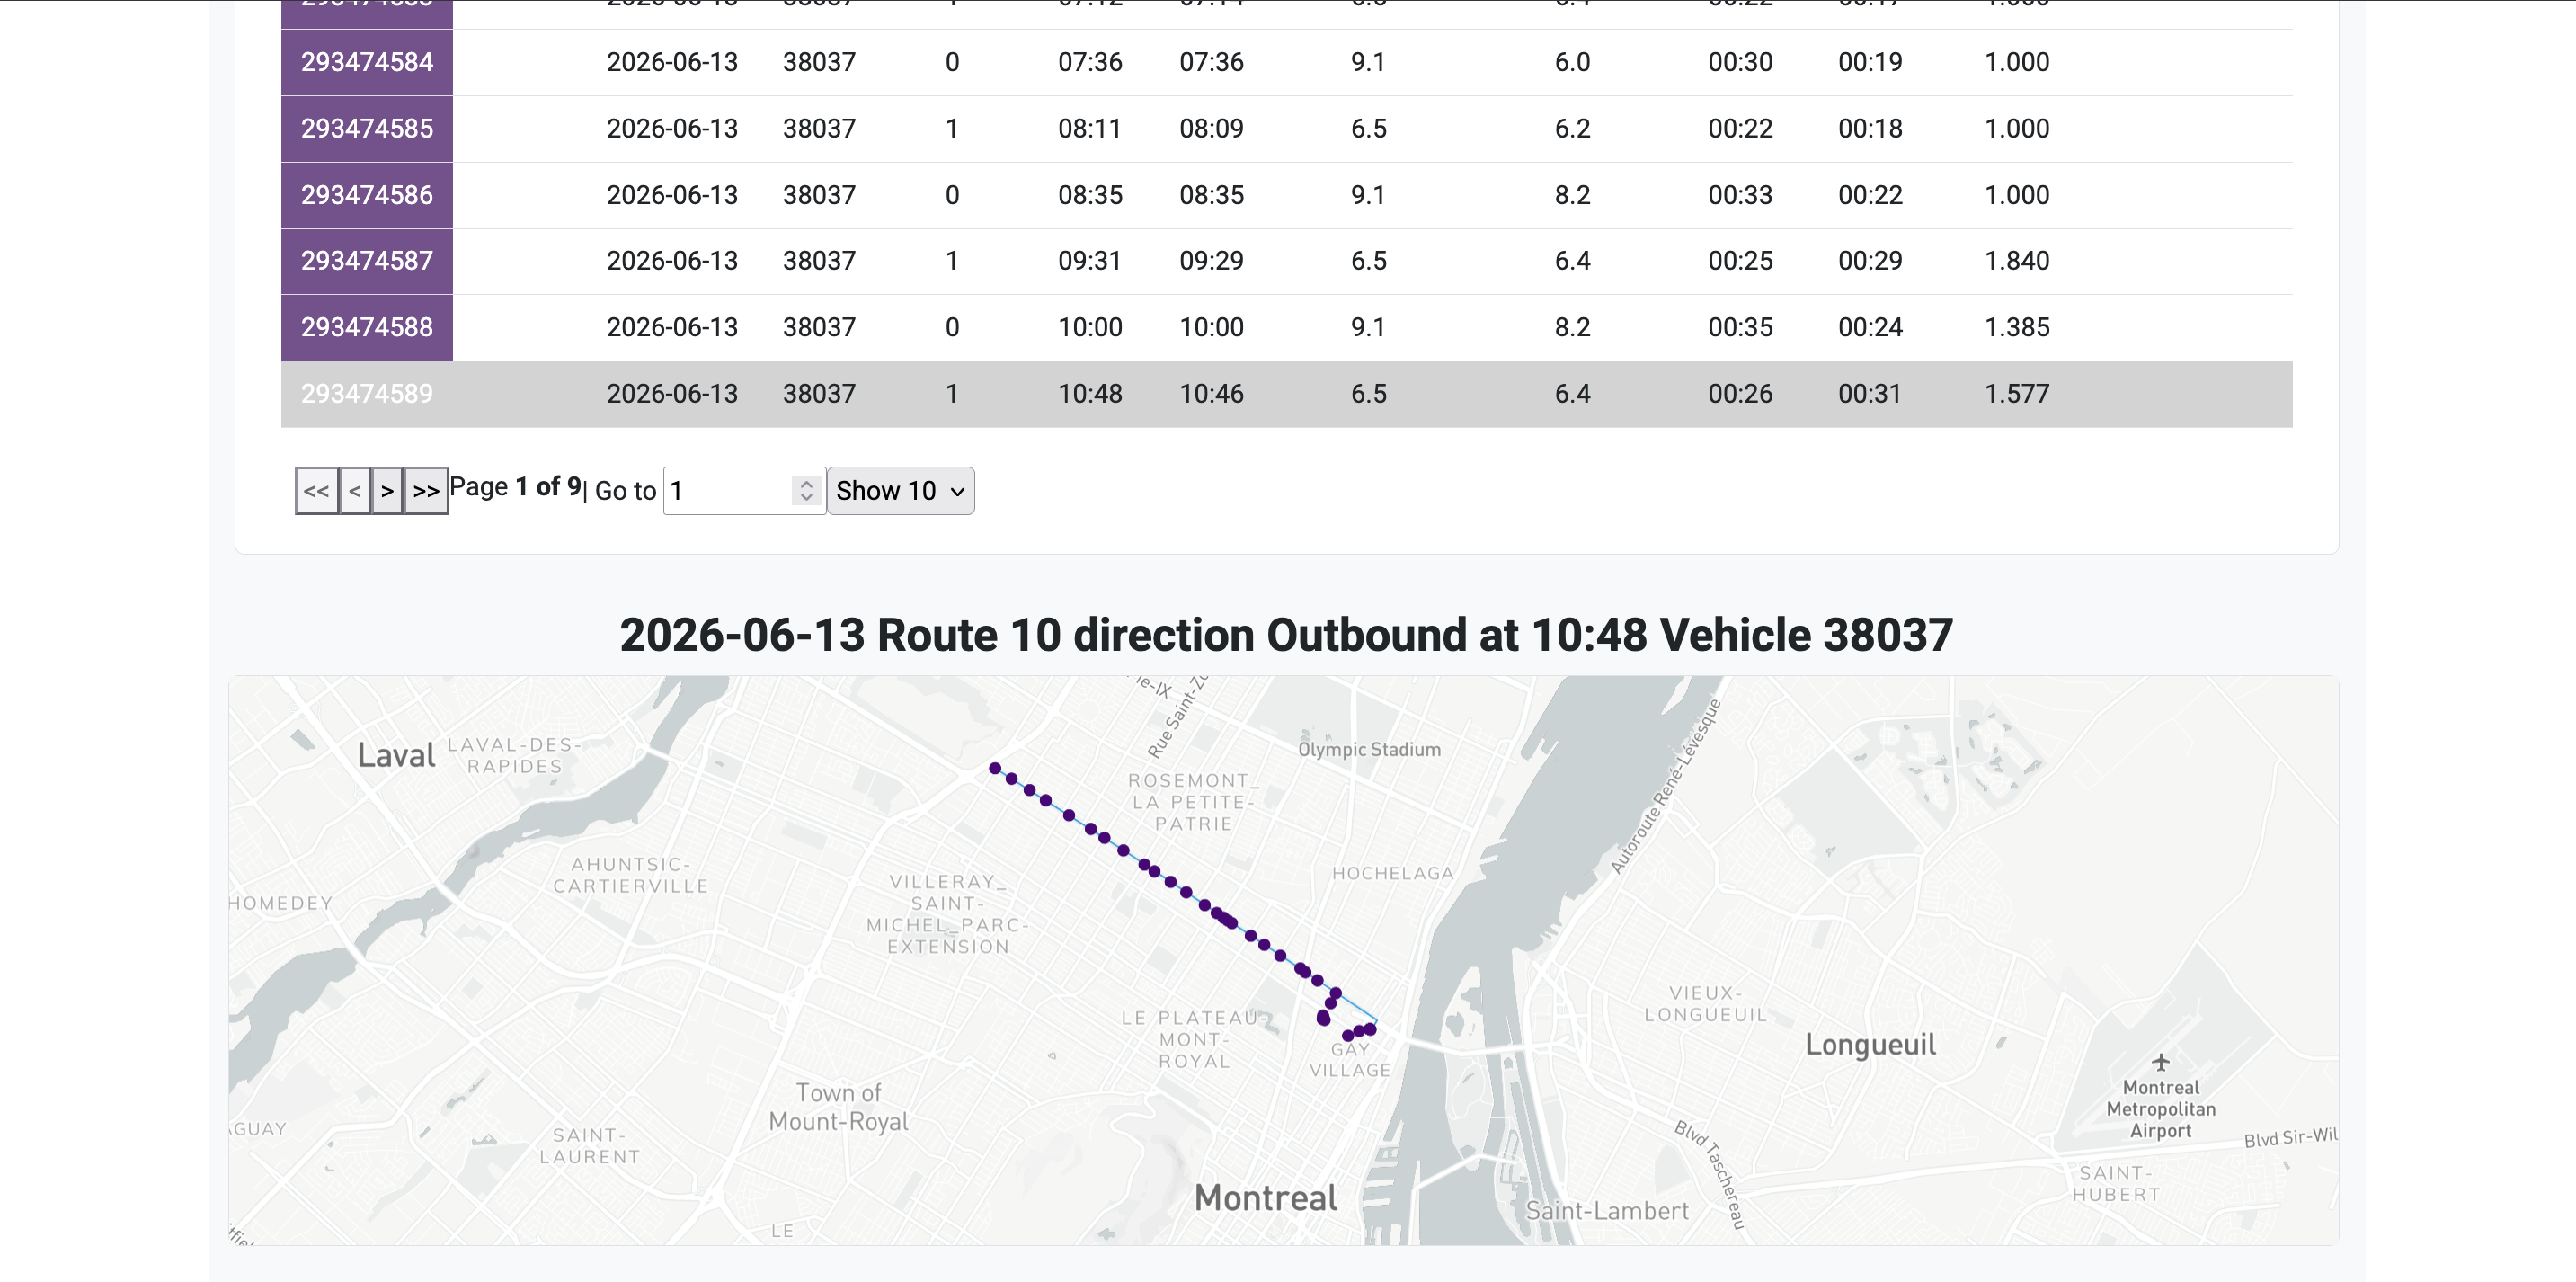
Share dashboards organization-wide, automate report mailings, and extract data for custom reports.
Designed for transit agencies that need analytics without complexity — easy to deploy, easy to share, and easy to customize.
Give operations, planning, and management teams access to the same analytics — no siloed spreadsheets or duplicate reports.
Full compatibility on phone, tablet, and desktop. Access dashboards wherever your team needs them.
Cloud-based platform with nothing to install on user devices. Connect through your browser and start analyzing.
Leverages data from your current on-board systems — no additional hardware installation required.
GTFS, GTFS-Realtime, CAD/AVL, and ridership feeds are processed automatically so metrics stay current.
Schedule and deliver performance reports to stakeholders without manual preparation each period.
Monitor planned vs. actual service delivery, ridership, on-time performance, and fleet utilization with automated calculations.
Connect the operational data your agency already produces. Bus RT Insights uses your existing on-board infrastructure — no additional installation required.
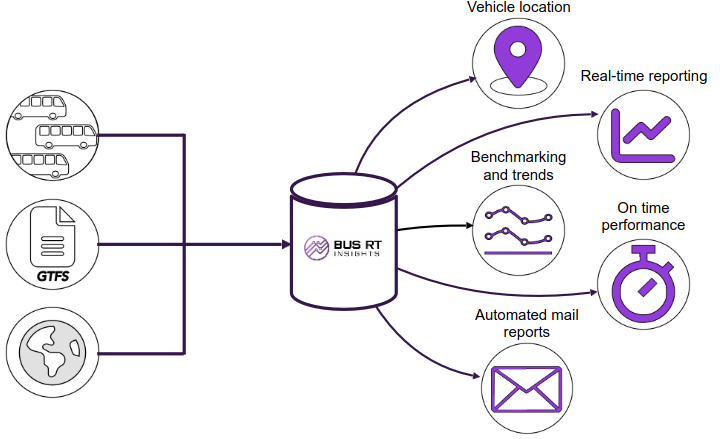
Move from manual reporting to automated, shareable operational intelligence.
Schedule a personalized demonstration of Bus RT Insights.
Request Demo